
A Quick Overview
Let's take a quick look at the key BikePro features. Just keep in mind that there's no substitute for the real thing. The following will give you a small sampling of BikePro. To see for yourself, go ahead and download a copy. BikePro has a comprehensive context sensitive help system describing every screen and field in BikePro. After spending fifteen minutes with BikePro, you'll have a much better understanding of the application than I could ever provide with the best screen shots and descriptions.
Click on a screen name below to go directly to the screen or just scroll down to view them all.
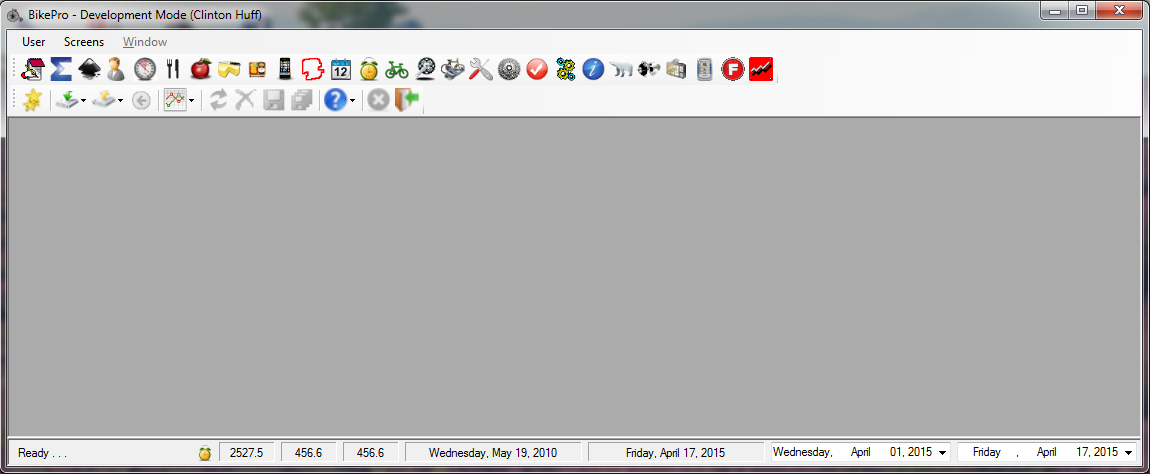
All BikePro screens are displayed within the Main screen. Across the top are the tool bars used to open the various screens. The tool bars can be docked on the left or right side as well as the top of the screen. Across the bottom of the screen are summary values for the total distance ridden in the current year, the total distance for the current month and the total distance for the selected date range. This is followed by the date of the first and last Training Log entries. The last two fields are used to set the active date range. The Training Log and some other screens use this date range to limit the amount of data displayed. The small clock icon on the left bottom of the screen indicates there are reminders. Click on this icon to display the Reminder screen.
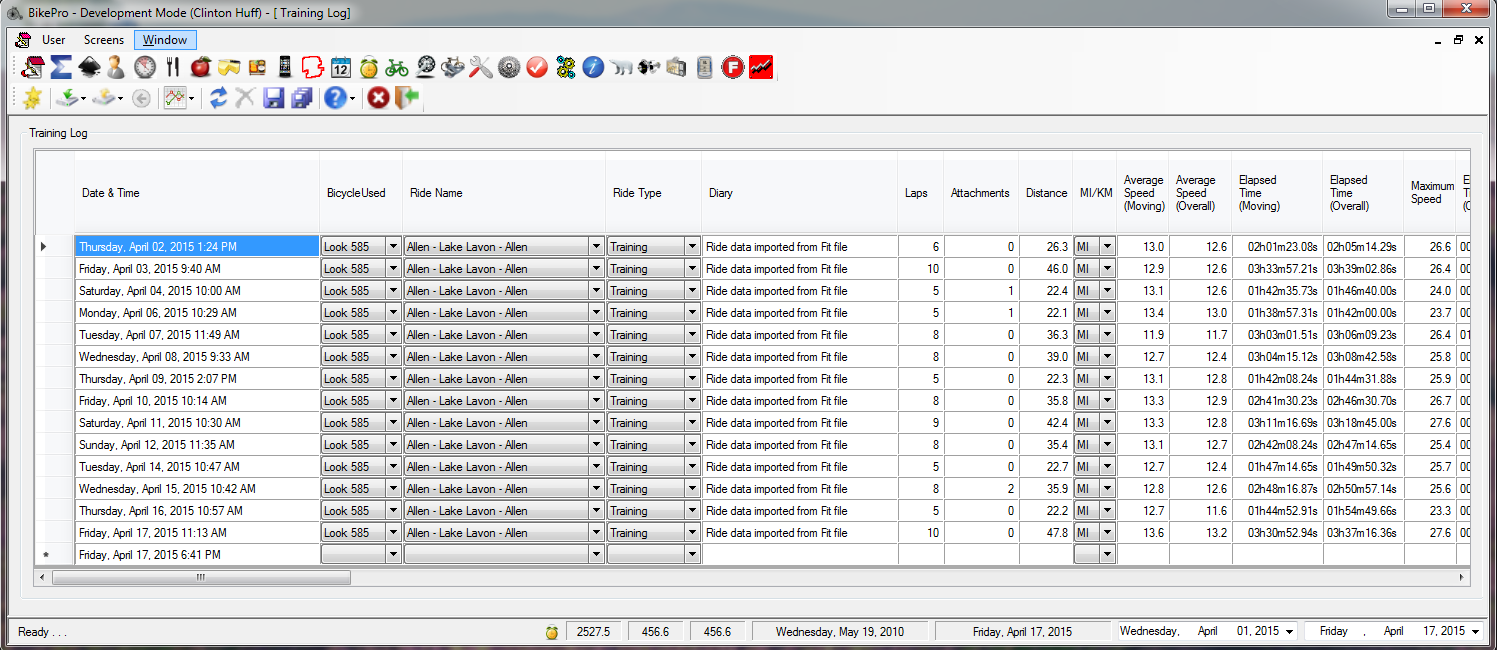
The heart of BikePro is the Training Log. The Training Log records over seventy-five pieces of data. What if you don't need everything? The Training Log can be configured to hide information you don't need.
You can enter data manually, or import it from various bike computers such as Garmin, Power Tap or Polar. It will also import data from any GPS device that exports data in GPX format or from any source that can provide it in TCX or FIT format.
If you choose to enter data manually, an entire ride can be entered with a single mouse-click. All basic information is entered based on your "favorite ride". Of course you won't have the advanced information such as power and heart rate data, unless you manually enter it.
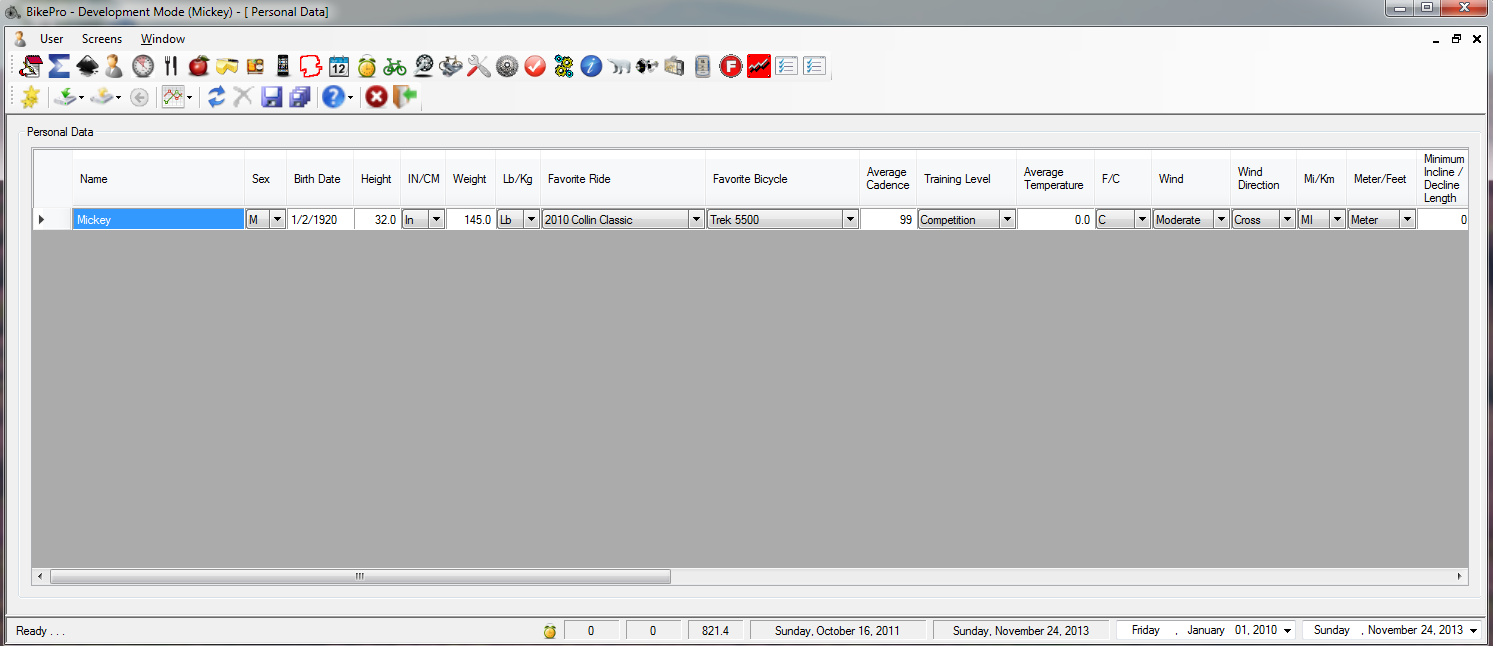 .
. BikePro can be used by multiple riders. Use the Personal Data screen to enter information about each rider. "Out of the box", BikePro comes with a "Team Captain" rider. When you log in as the Team Captain, you can view information about all riders and add new riders. This is also where you enter your personal preferences such as distance and temperature unit of measure. You also enter your heart rate training zones and diet goals on this screen.
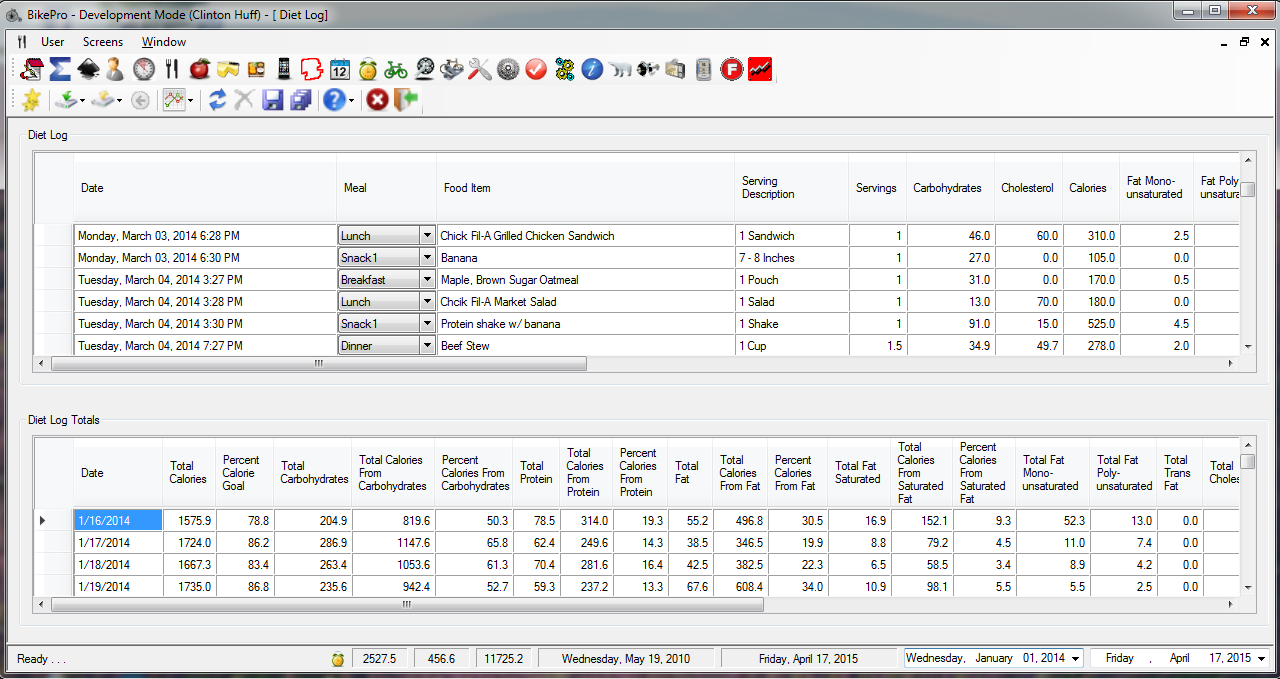
A proper diet is essential to a good training regimen. The Diet Log allows you to enter information about everything you eat. Individual entries are shown in the top section of the screen, while daily totals are shown in the bottom section.
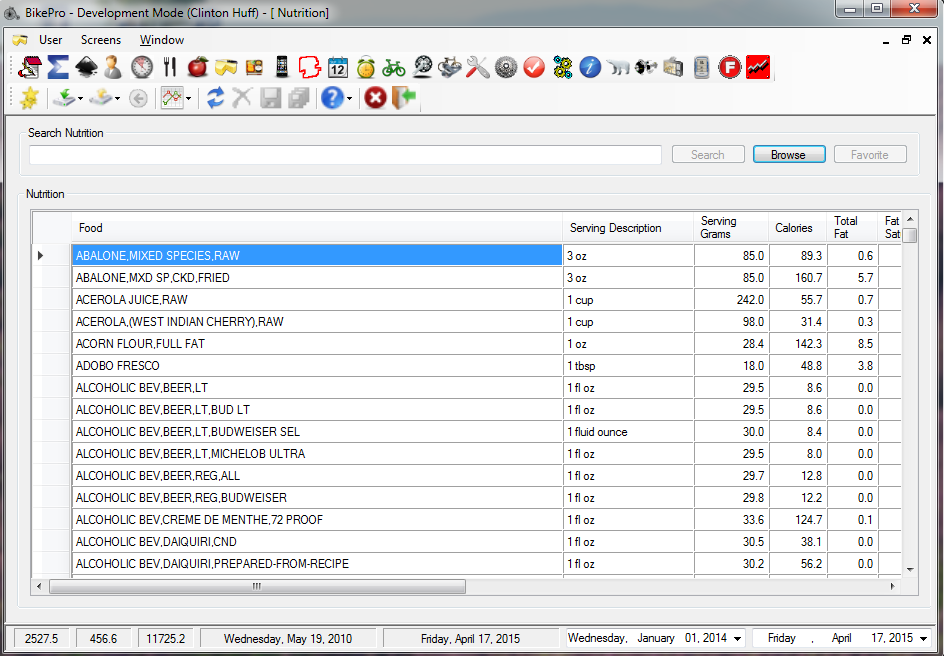
Diet Log entries are made from the Nutrition screen. This is a searchable USDA nutrition database. To add an item to the Diet Log, double-click on the item and the Add Item To Diet Log screen is displayed.
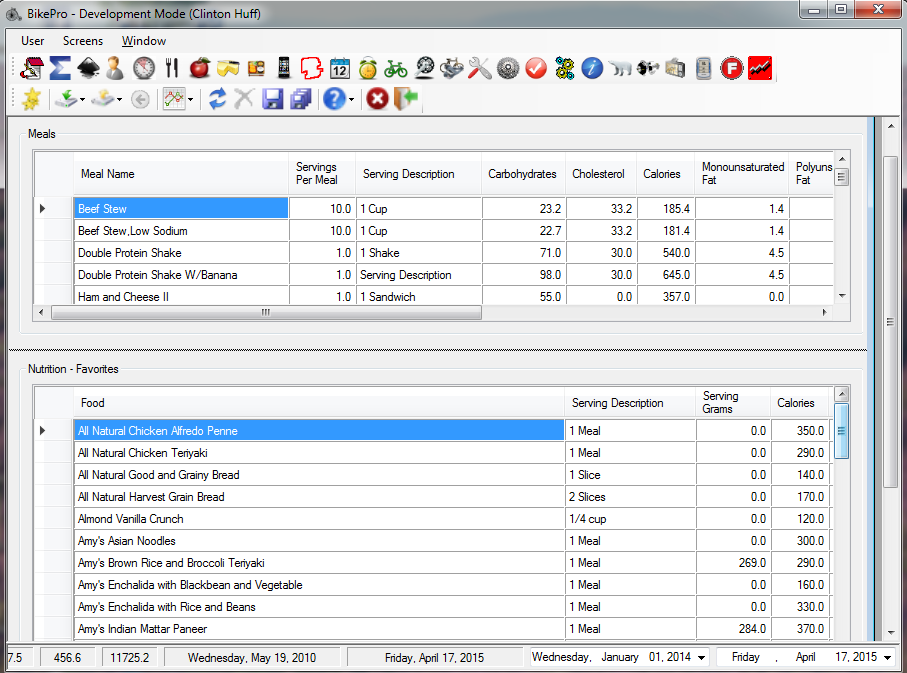
The bottom section of Nutrition Favorites Screen is used to manually enter information about food items from food labels or any other source. The top section of the screen is a list of meals that have been defined on the Meals screen. Double click an item in either section and the Add Item To Diet Log screen is displayed.
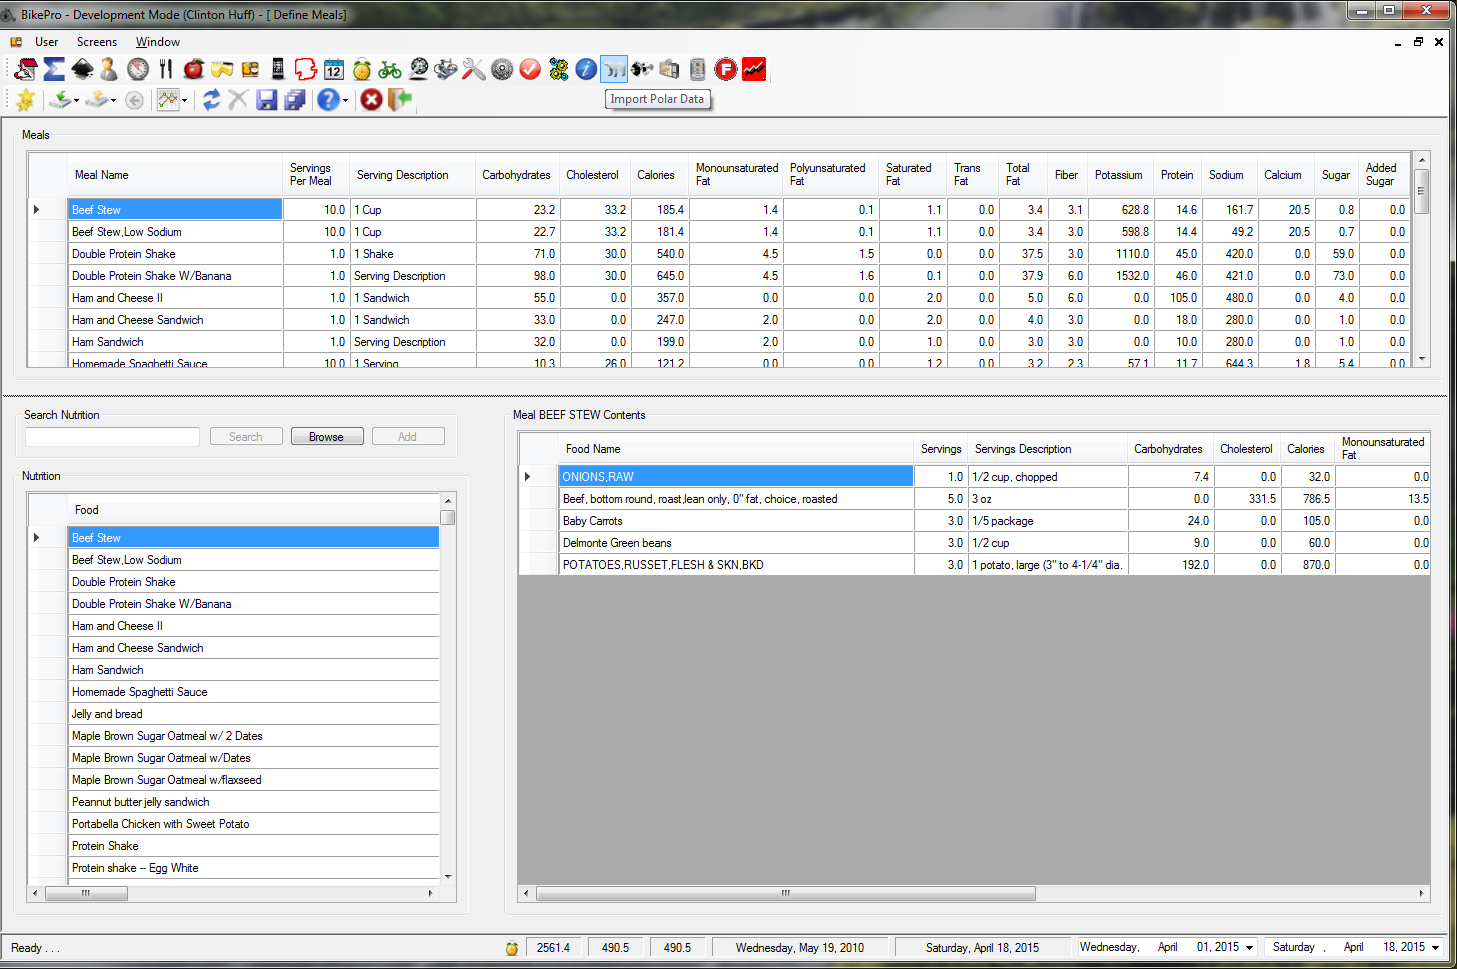
The Meals screen is used define complete meals in terms of the meal components or ingredients. When a meal is selected in the Meals section, the meal contents are displayed in the Meal Contents section. Items are added to the meal by selecting the item in the Nutrition section and clicking the Add button. Double click on a meal to display the Add Item to Diet Log screen.
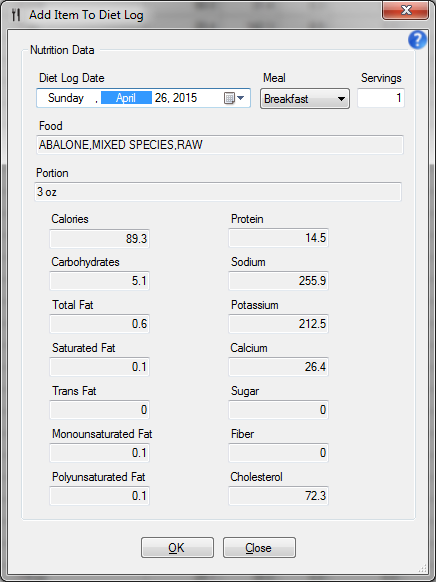
This screen is displayed to add an item to the Diet Log. Just select the Diet Log date meal and number of servings, and click OK.
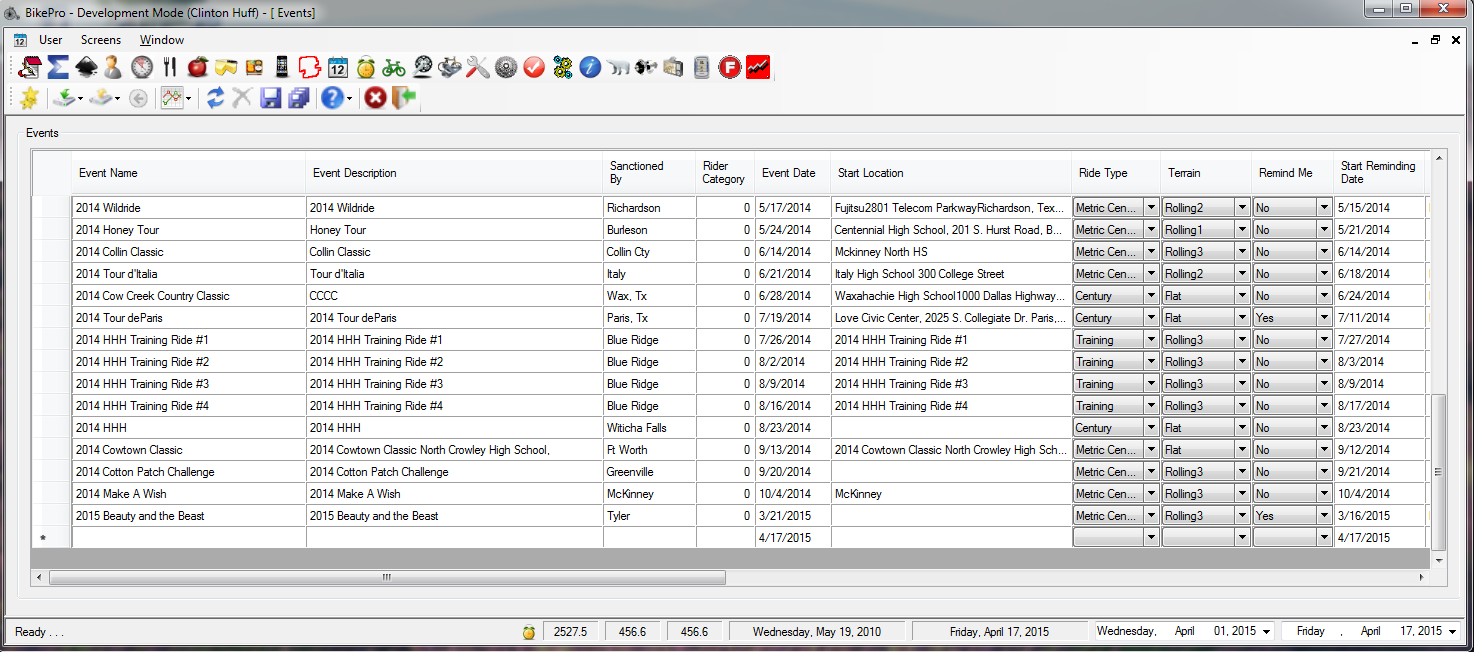
Using the Events screen, you will never forget an upcoming event. If you like, you can enter your entire race or event schedule here. Then tell BikePro to remind you and when to remind you. After the event, just mark the event complete and it will automatically gather summary information about the event from the Training Log and show it on the Event screen.
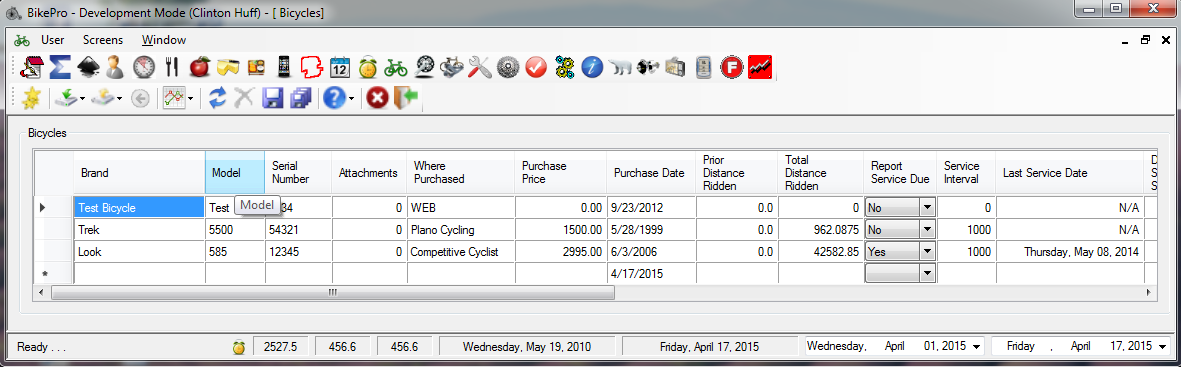
Every Training Log entry includes the bicycle that was used. Use the Bicycle screen to enter information about available bicycles. Enter a service interval in miles (or kilometers) and BikePro will remind you when a service is due. When a bicycle is used for a ride, the ride distance is added to the accumulated miles since the last service. When the accumulated miles exceeds the service interval, a reminder is posted. When a service for the bicycle Is entered in the Service Log, the accumulated miles is automatically reset and the reminder is cleared.
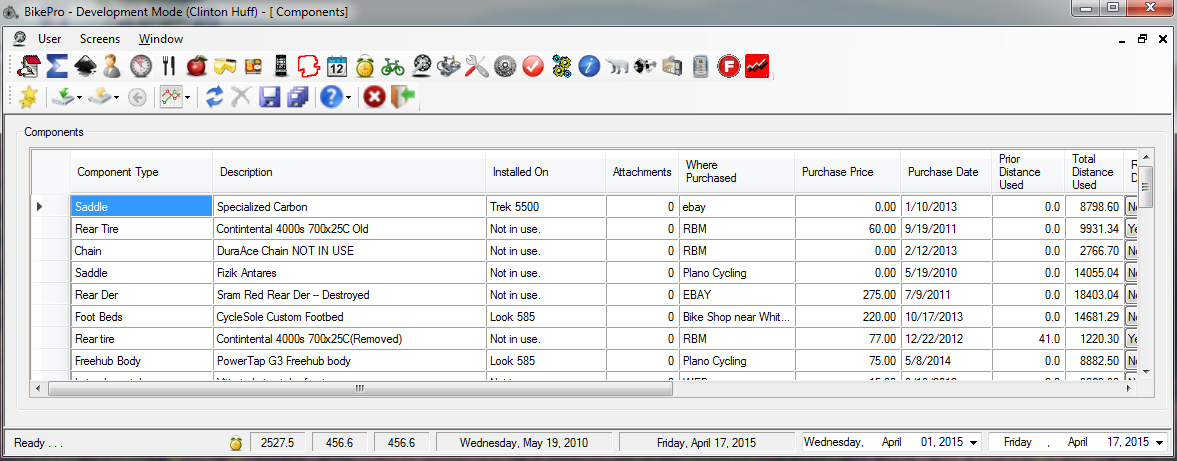
In case you want to track the usage and service interval of individual components, the Components screen can be used. For example, you might want to keep track of how many miles are on your new set of tires. Just make an entry for the tires on this screen and then use the Bicycle-Components screen to assign the tires to a specific bicycle. Then, any time the bicycle is used, the ride distance is accumulated for the tire as well as the bicycle.
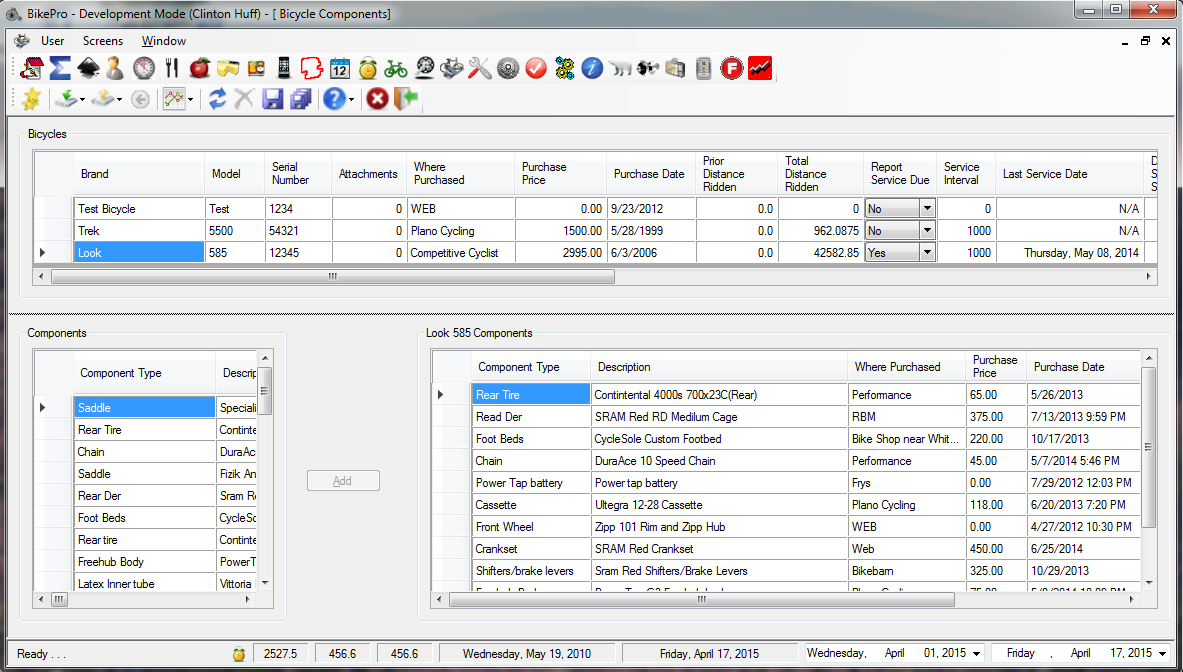
If you entered components on the Component screen, you'll want to use this screen to assign each component to a bicycle. Actually, a component can be assigned to more than one bicycle. Thus is useful if you have components that are switched between bicycles. Perhaps you have a PowerTap wheel that is used on multiple bicycles. This lets you track it's total mileage regardless which bicycle is used.
Data Analysis
The performance data captured by BikePro is of limited value. The following is a brief description of the additional data analysis provided. The descriptions are brief and assume you understand what the information means. If not, the graphs are based on fairly standard performance metrics, which, if not self-explanatory, a quick search of the Internet should provide several articles about each metric.
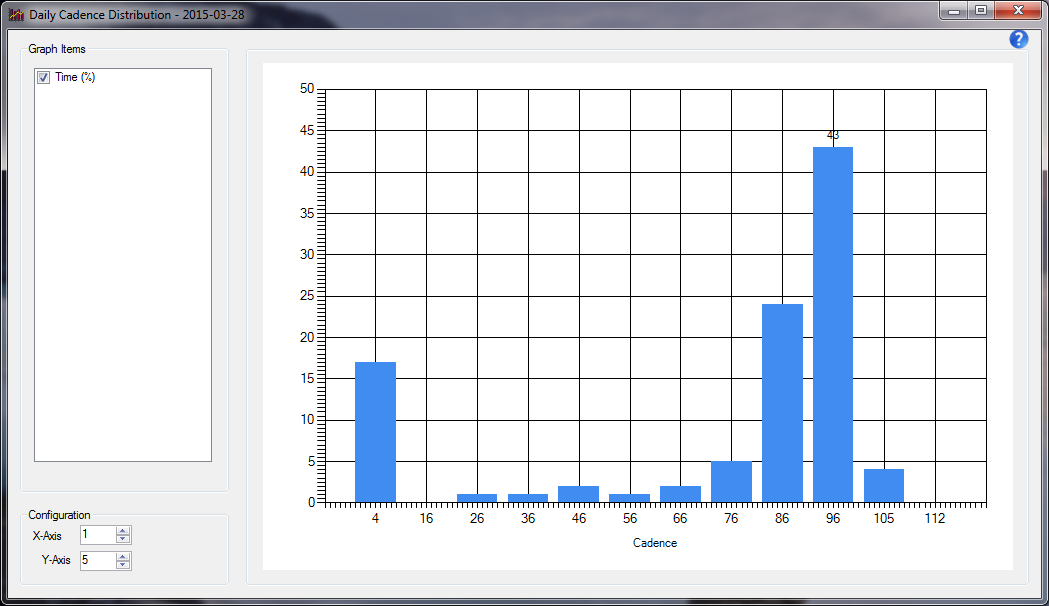
The Cadence Distribution graph shows the percentage of overall ride time spent at each cadence.
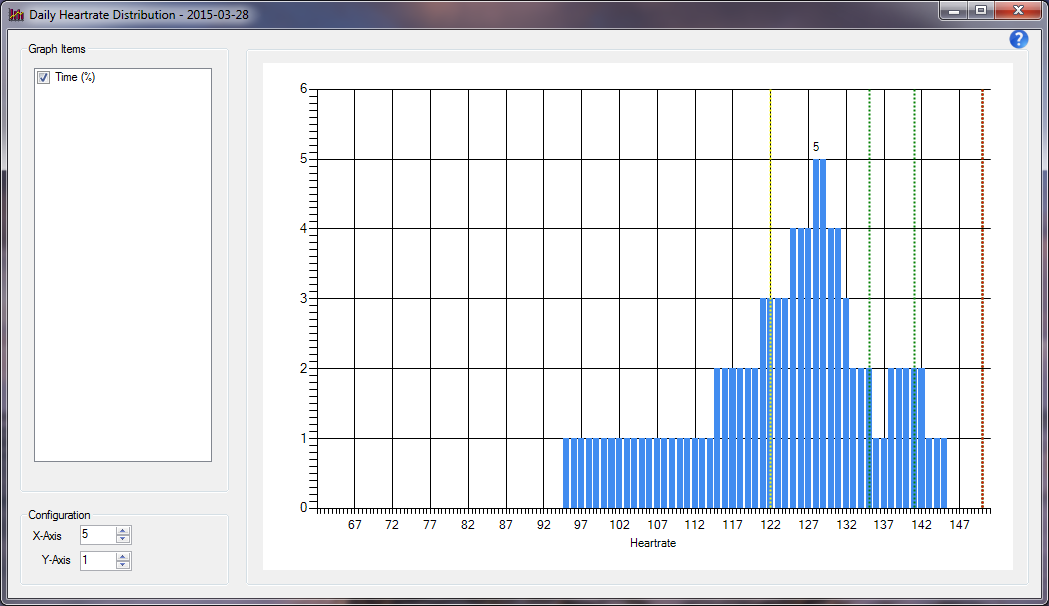
The Heart Rate Distribution graph plots heart rate against the percentage of ride time at that heart rate.
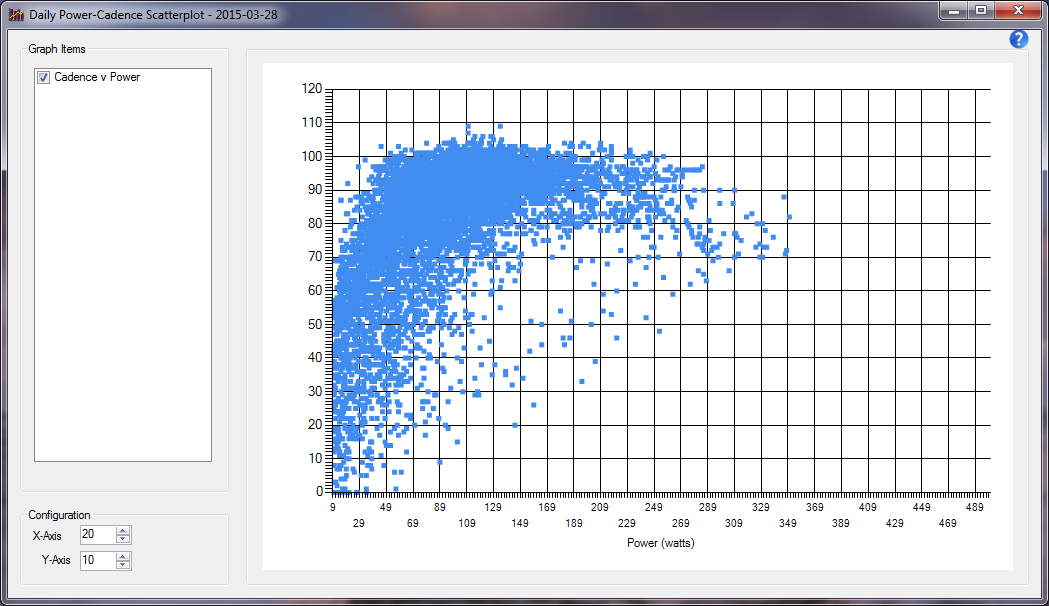
The Power-Cadence Scatter Plot is a graph that plots your cadence against your power at that cadence. Each point on the graph represents a power-cadence combination.
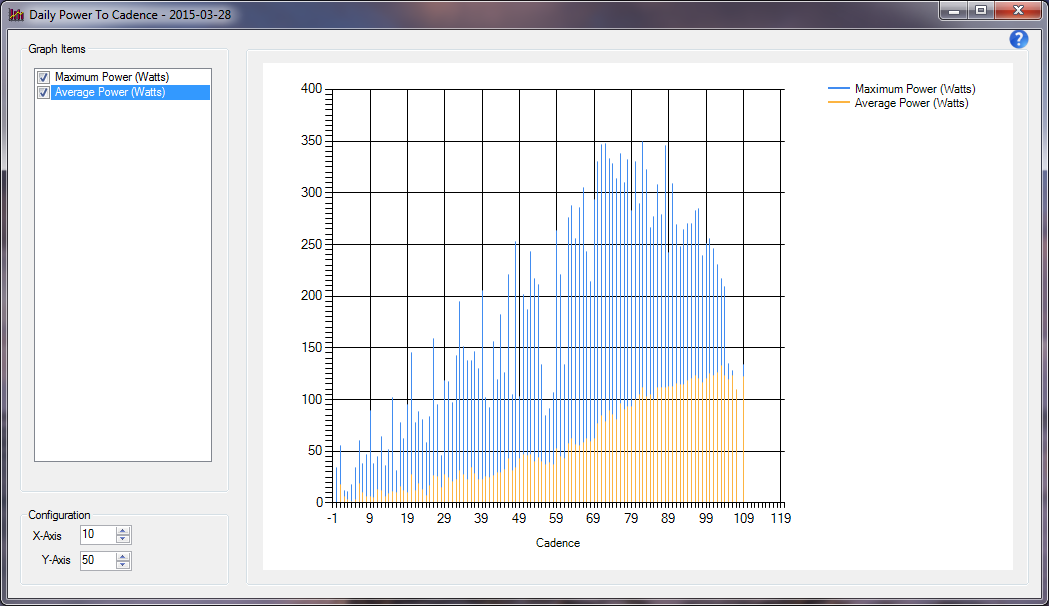
The Power to Cadence graph plots power against the cadence at which the power was produced. Two graphs are available: maximum power for a given cadence and average power for a given cadence.
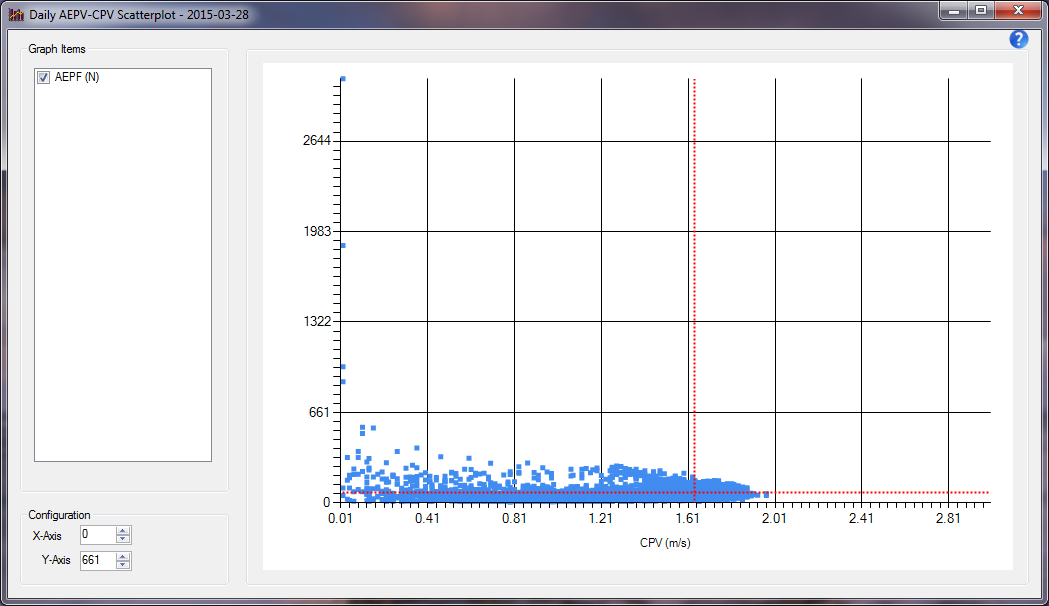
This graph is similar to the Power-Cadence Scatter plot except this one plots Average Effective Pedal Force (AEPF) against Circumferential Pedal Velocity (CPV).
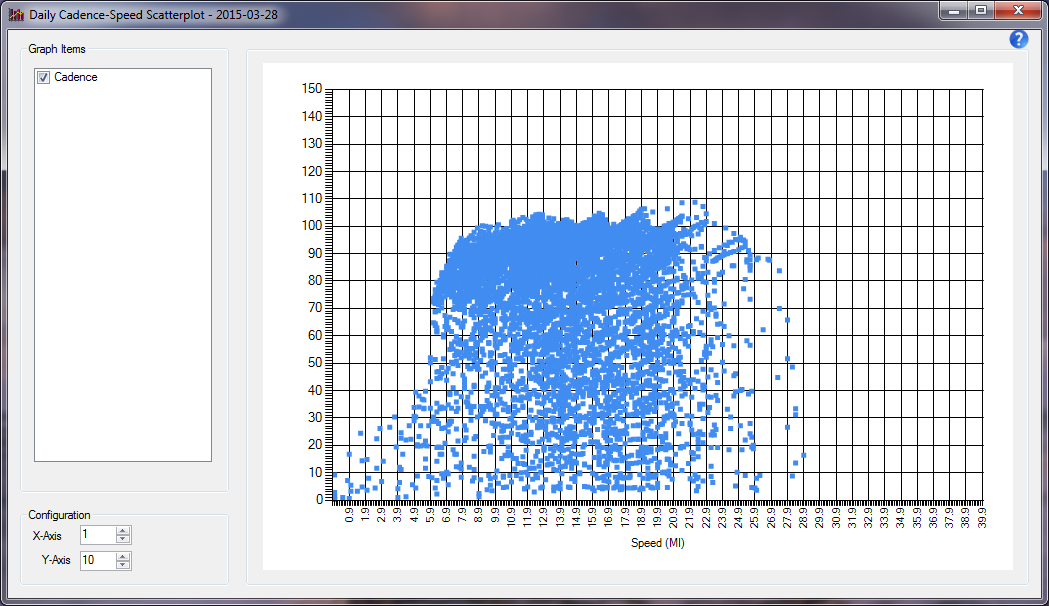
This scatter plot maps speed against the cadence used to produce the speed. Each point on the graph is one speed-cadence combination.
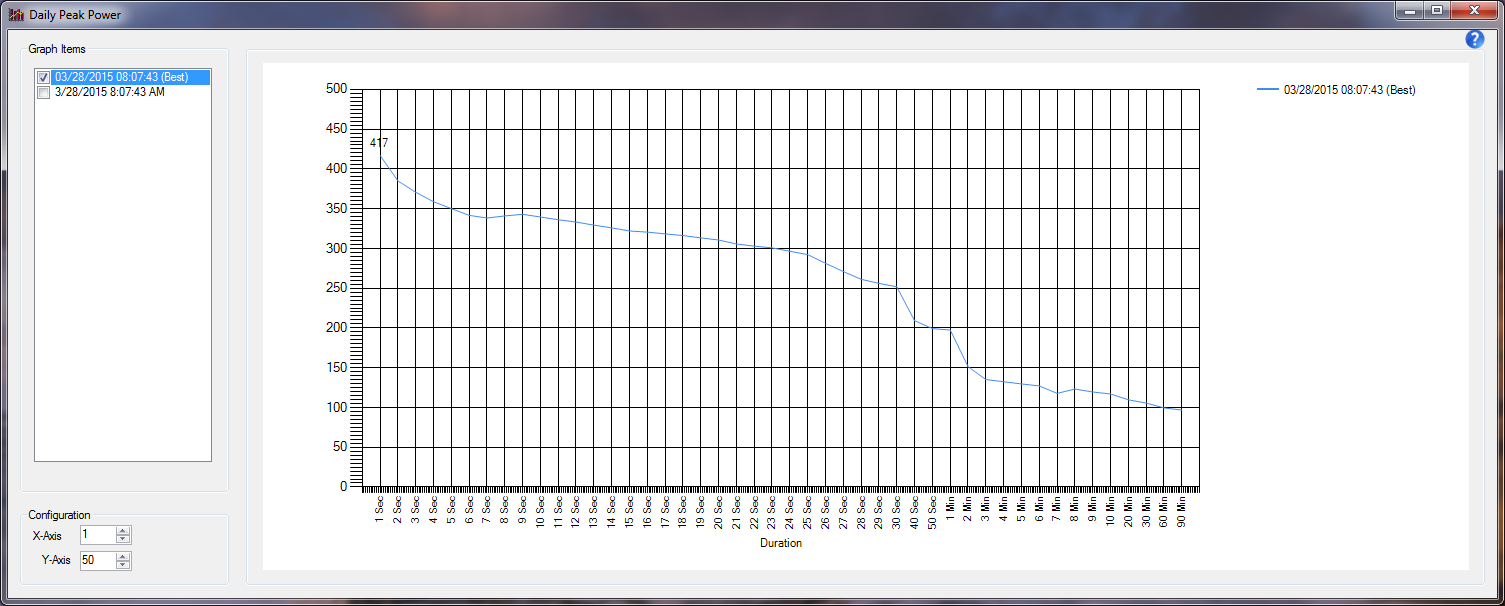
The Peak Power graph plots the peak power produced for each time interval, ranging from 1 second to 60 minutes. Two graphs are shown: The best for the current date range and the selected ride.
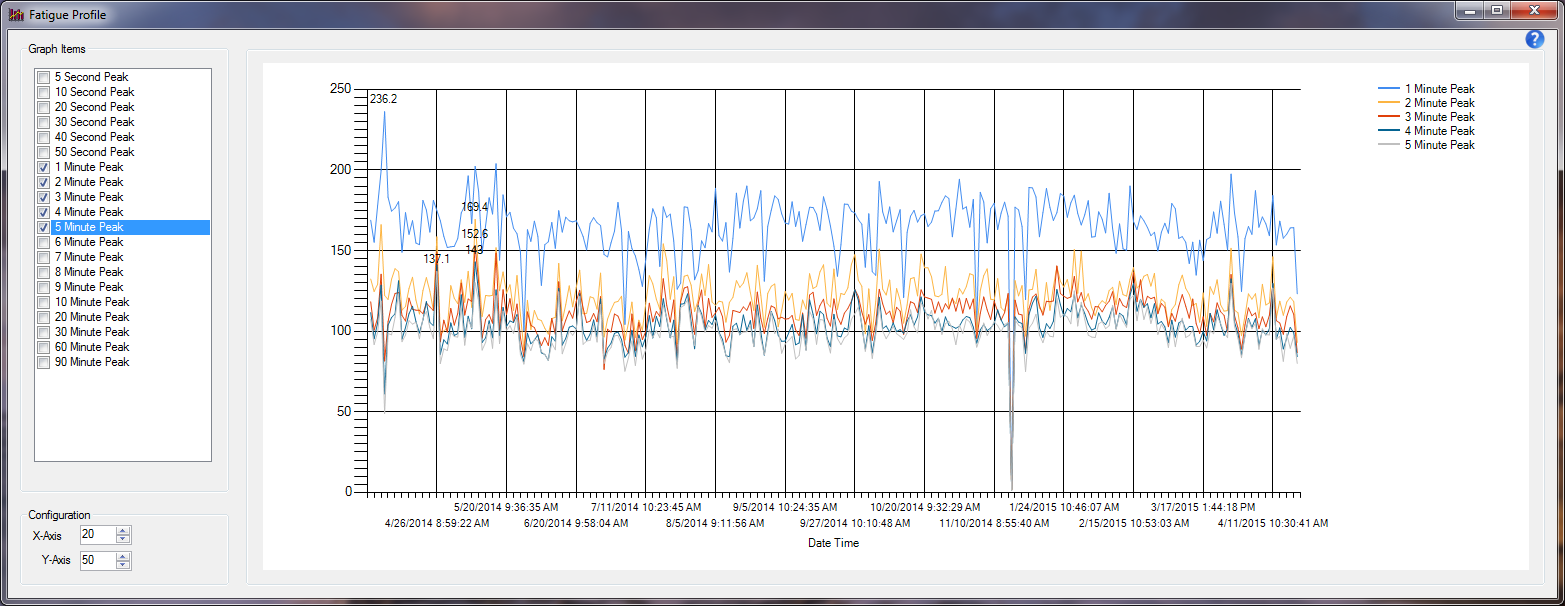
The Fatigue Profile graph plots your peak power for 5 seconds through 90 minutes, across the selected date range. In the graph above, there is a large gap between the one minute and two minute power. This indicates that fatigue begins to set in between one and two minutes.
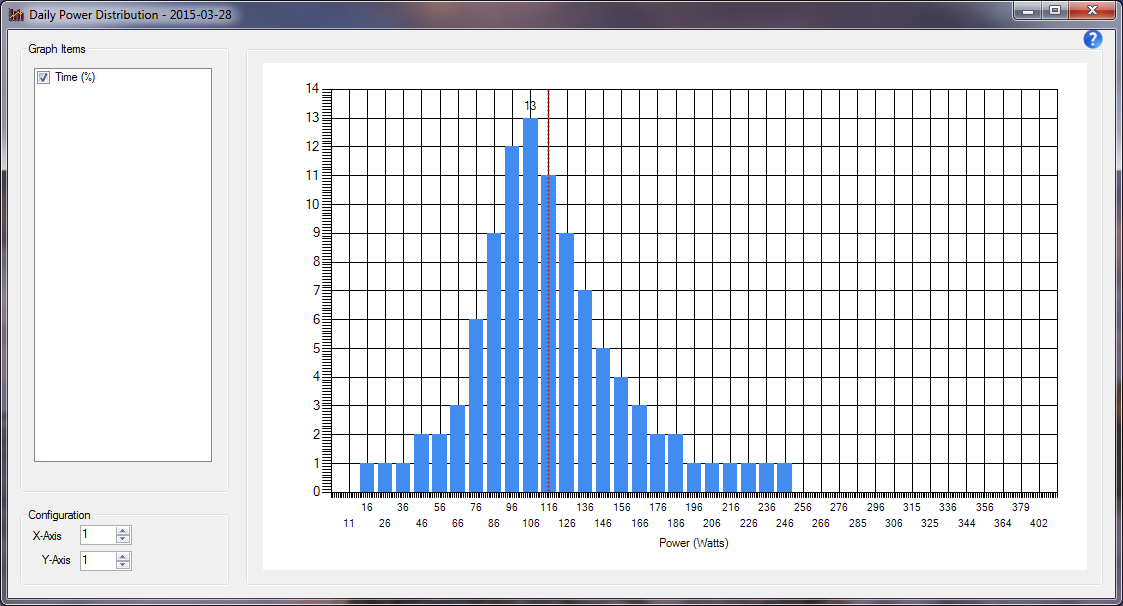
The Power Distribution chart is a histogram showing the total percentage of time you spent producing the various amounts of power.
What You'll Need to Get Going
First, you'll need Microsoft Windows. This could be Vista, Windows 7 or 8. I can't guarantee that BikePro will run on Windows XP or earlier versions of Windows because it has not been tested on these older Operating Systems.
Next, you need to down load BikePro. After you download the file, just run BikePro.msi to install BikePro.
That's all there is to it!